What will you learn from this article?
- Outcome harvesting is an evaluation approach that documents the outcomes of a program strategy by embracing complexity.
- The core principles of outcome harvesting include a contribution analysis, continuous iteration, engagement with key actors, and quantitative data collection.
- These approaches are well suited to reveal unexpected, more nuanced outcomes, particularly in complex environments.
In the realm of project management and evaluation, the quest for effective methodologies to capture and assess outcomes is ever-present. Among various approaches, outcome harvesting has emerged as a dynamic and innovative method that places emphasis on learning and adaptation. Our recent work with Agenda for Change allowed us to explore how outcome harvesting can serve as the core foundation for a results framework.
What is outcome harvesting?
Outcome harvesting is an evaluation approach that focuses on identifying and documenting the outcomes of a program strategy or strategic intervention without necessarily knowing what these are in advance. It embraces complexity, encourages actor engagement, and aims to capture unintended and unexpected changes that have occurred. Outcome harvesting provides a flexible, realistic approach to measuring progress.

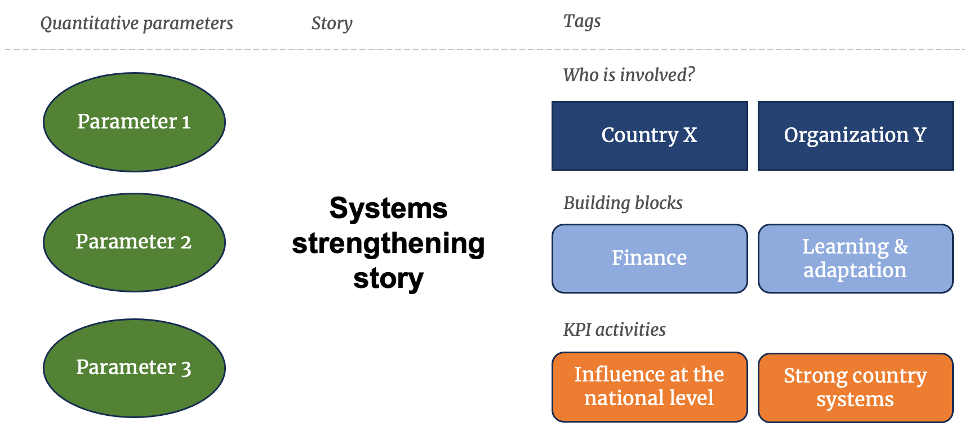
Figure 1: Outcome harvesting as an evaluation approach
The core principles of outcome harvesting
- Contribution Analysis: Outcome harvesting prioritizes understanding the contribution of the project to observed outcomes. It acknowledges that multiple factors influence outcomes and seeks to uncover the initiative’s role within the broader context.
- Iterative and Adaptive: Outcome harvesting acknowledges that outcomes can change and evolve over time, which allows for ongoing learning and adaptation.
- Engagement: This approach actively involves stakeholders throughout the process, recognizing their unique perspectives and knowledge. Stakeholders play a vital role in identifying outcomes and planning responses, resulting in a more inclusive and comprehensive evaluation.
- Qualitative Data Complements Quantitative Data : Unlike traditional evaluation methods that heavily rely on quantitative data, outcome harvesting emphasizes the collection of qualitative data. This includes narratives and stories that provide rich insights into the outcomes and the project’s contribution. Meanwhile, as shown in Figure 1, qualitative stories are complemented with quantitative data (i.e. parameters) in order to affect and evaluate progress on the basis of an organization’s Theory of Change. This process, in turn, enriches the narrative with quantitative information.
Outcome harvesting in practice
An example use case of outcome harvesting could potentially be to capture stories about systems strengthening. In this case, systems strengthening could be measured through stories being classified against building blocks through tags like #financing, #servicedelivery. The stories could be further contextualized with quantitative indicators, such as JMP service level information. In this way, outcome harvesting could be used to holistically examine how an organization’s work is impacting both systems and services.
Benefits of outcome harvesting
Outcome harvesting is particularly well-suited and useful in operations in complex environments with many actors. The approach enables a more nuanced understanding of outcomes which may not be apparent in traditional approaches. Furthermore, by adopting an iterative and adaptive approach, outcome harvesting promotes continuous learning and improvement. One of the key benefits of outcome harvesting is that it is excels at revealing unexpected outcomes, which may include both positive and negative effects. By actively involving stakeholders throughout the process, outcome harvesting fosters ownership and enhances the credibility and usefulness of evaluation results. It builds trust and encourages collaboration among diverse actors.

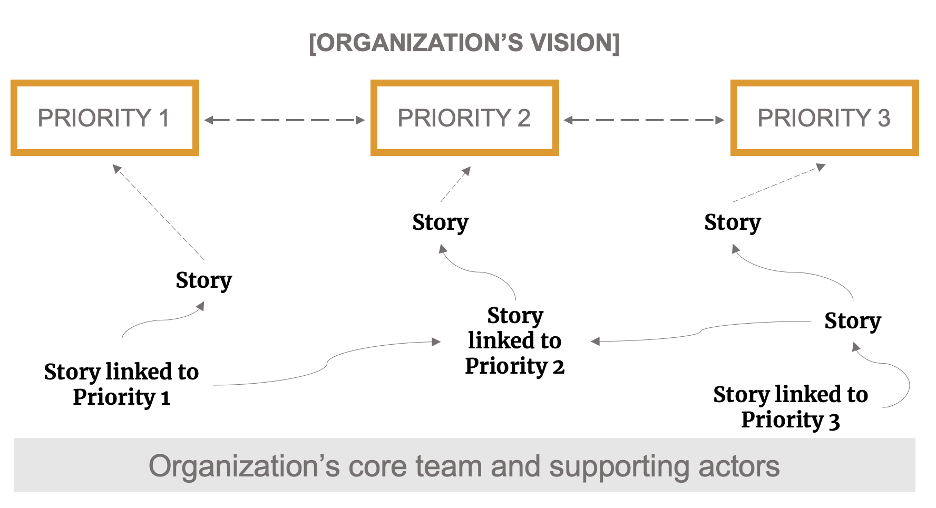
Figure 2: How are stories are linked to organizational vision and priority areas?
Outcome harvesting offers a new perspective on results frameworks, shifting the focus from rigid indicators to a more adaptive and learning-oriented approach. By embracing complexity, engaging stakeholders, and capturing unexpected outcomes, this methodology unlocks insights that traditional evaluation methods may overlook.
We’re curious to know, have you used outcome harvesting in any of your projects? If so, how? What were the key learnings, challenges, surprises?
