I am excited to share with WPDx a preprint of a study comparing different ways of measuring access to water services. . Comment and download the pre-print here: https://doi.org/10.31219/osf.io/kjry2
It builds on the work of the jmpwashdata data science library that I started last year to enable researchers to use JMP WASH data like never before .
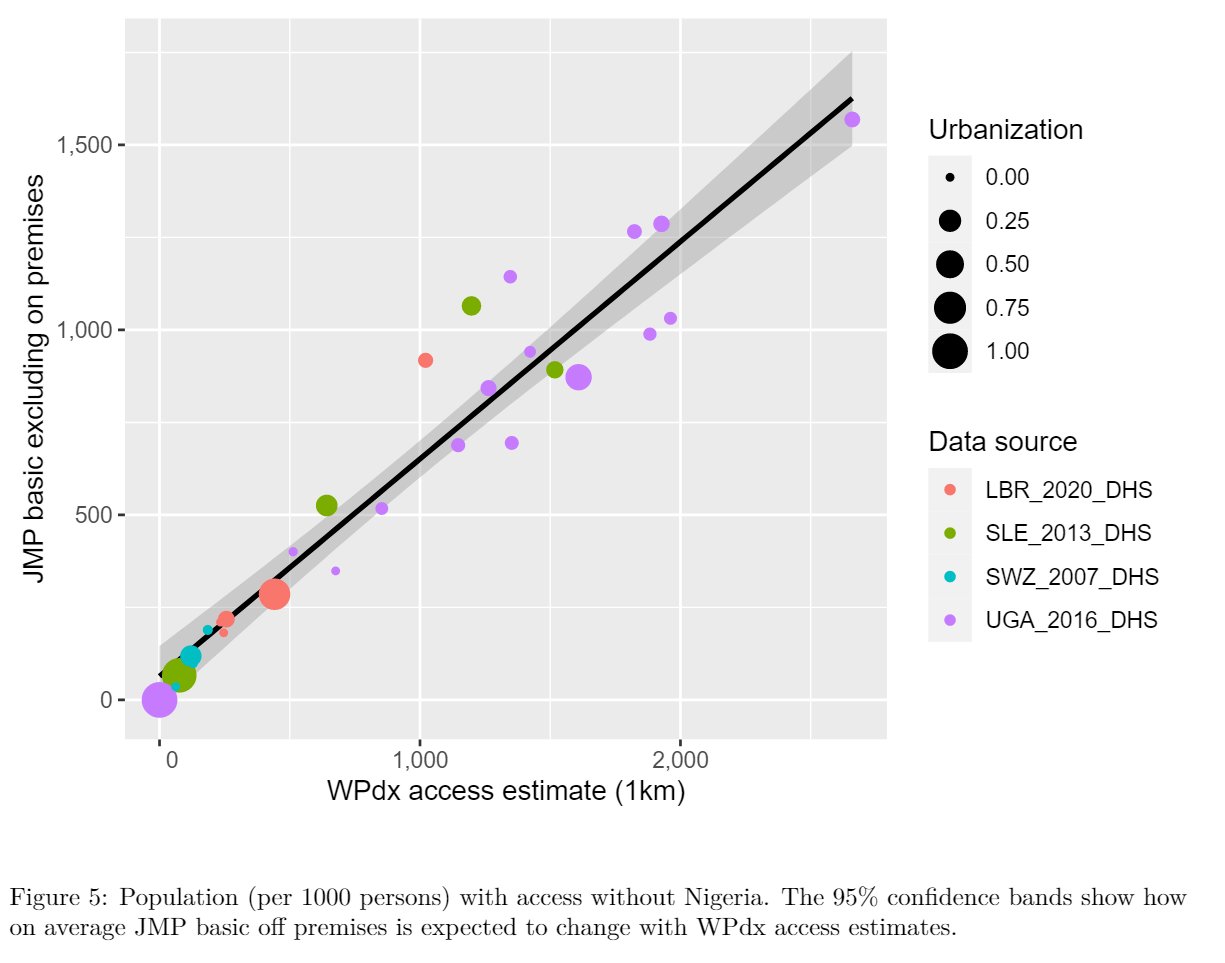
The purpose of the study is to determine how water point level estimates for rural basic water service coverage from the Water Point Data Exchange (WPdx) compare to the household level estimates from the Joint Monitoring Programme of WHO/UNICEF (JMP) in multiple geographies. The study describes how these different estimates are produced and proposes the comparison of JMP basic minus services on premises to WPdx basic access. WPdx basic access estimates the population with 1km of an improved water point. Comparing between metrics and triangulating different measured results can be useful to validate conclusions and inform decision making. This study finds a relatively strong correlation and linear trend between these two estimates in four countries that suggests that using household surveys and water point inventories together can be useful to decision makers who may only have one or the other data sources or may want to validate the conclusions from one against another. The WPdx basic estimates allow a more granular geographical level of access estimates that can be useful to districts and enable national vulnerability assessments. This could strengthen the type of analysis provided in JMP inequality charts showing the differences between country regions. At the same time, further research is needed to validate these trends at these lower geographical levels. Rural water leaders, including national and local governments, development partners, service providers and civil society should continue to advocate for the publication of water point data and the validation of access estimates on the basis of publicly available information. This plays an important role in improving the quality of both public and private data sets and analyses used by researchers and decision makers.
Read more about the study in the WPDx blog.
Acknowledgements
This study would not have been possible without the contribution of open data on water points by data providers to WPdx. Members of the Water Point Data Exchange (WPdx) working group reviewed both the proposal and findings of this work. Katy Sill of WPdx first recognized the potential of the work, provided invaluable feedback, and responded quickly with explanations about how the WPdx algorithms work while investigating and delivering improvements to the tools when required to make this comparison possible.
Similarly, the National Statistics Offices (NSOs) and the Demographic and Health Surveys (DHS) Program of the United States Agency for International Development (USAID) made it possible to use household survey data from different countries. I would like to thank the Joint Monitoring Programme of WHO/UNICEF (JMP) team for sharing country, regional and global estimates of progress on drinking water, sanitation and hygiene (WASH) in households as well as the estimates for the sub-indicators required to generate those estimates, for providing clarifications about the JMP methodology, and for taking time to reflect on study findings.
This material is based upon work supported by USAID under award number 7200AA18CA00033.